Principle Analysis of the Distributed Pressure Test System for the Plantar Foot
I. Core Hardware Composition
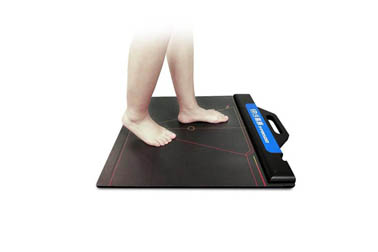
Sensor Array
The system captures the pressure data of various areas of the plantar foot (forefoot, midfoot, heel) in real time through the thin film pressure sensor matrix (such as capacitive and piezoresistive sensors) of the pressure plate. The sensor density can reach 1-3 per square centimeter, and the accuracy error is ≤5%.
Dynamic Acquisition Module
When walking, the sensor records the plantar pressure distribution at a high sampling rate of 100-1000Hz, and simultaneously captures time parameters (such as the duration of the support phase) and spatial parameters (such as the movement trajectory of the pressure center).
II. Working Principle Process
Static Pressure Analysis
When the subject stands still barefoot, the system generates a plantar pressure heat map and calculates the Arch Index (AI). AI = midfoot area pressure / total plantar pressure, which is used to determine the degree of flat feet (normal arch: 0.21-0.28, severe flat feet> 0.32).
Dynamic gait monitoring
During exercise, the system tracks the peak position of plantar pressure (such as the 2-3 metatarsal base), pressure-time integral value (PTI) and the symmetry of the center of gravity trajectory to identify abnormal gait patterns (such as excessive pronation or eversion).
Three-dimensional data modeling
Combined with the 3D scanning data of the foot, a biomechanical model such as arch height and navicular drop distance is constructed to provide parameters such as support point height and heel cup inclination angle for the design of corrective insoles (error ≤ 1mm).
III. Data analysis and output
Pressure distribution visualization
The analysis software converts the raw data into a color pressure cloud map (red is a high-pressure area and blue is a low-pressure area), and annotates key indicators such as peak pressure and contact area ratio.
Abnormal gait diagnosis
By comparing with the database of healthy people, the characteristics of plantar pressure imbalance are identified (such as high pressure on the lateral side of the calcaneus indicates eversion of the foot, and excessive concentration of forefoot pressure indicates arch collapse).

Pingback: Foot Scanner_Foot Shape Scanner_Gait Analysis Equipment_Gait Analyzer Manufacturer_Gait Analysis System
Pingback: Foot Scanner_Foot Shape Scanner_Gait Analysis Equipment_Gait Analyzer Manufacturer_Gait Analysis System